- Your Money & Your Life
- Posts
- Inflation comes in better than expected + the Swiftie Effect
Inflation comes in better than expected + the Swiftie Effect
My Money Digest - 5 April 2024
David Koch
April 05, 2024

Hi everyone,
Hope you had a terrific Easter break. It’s one of my favourite times of the year - a long, long weekend which is a lot more chilled than Christmas. We had the family move in and it was hilarious to see one of our toddler grandchildren discover that, in her eyes, Easter is a festival of chocolate.
So, a bit of a catch up this week after the long weekend on what has been happening when it comes to your finances:
The latest inflation figures… sticky is the word for it.
RBA Board minutes show we’re at the peak of the cycle.
Aussies may be cash strapped but they still among the wealthiest in the world.
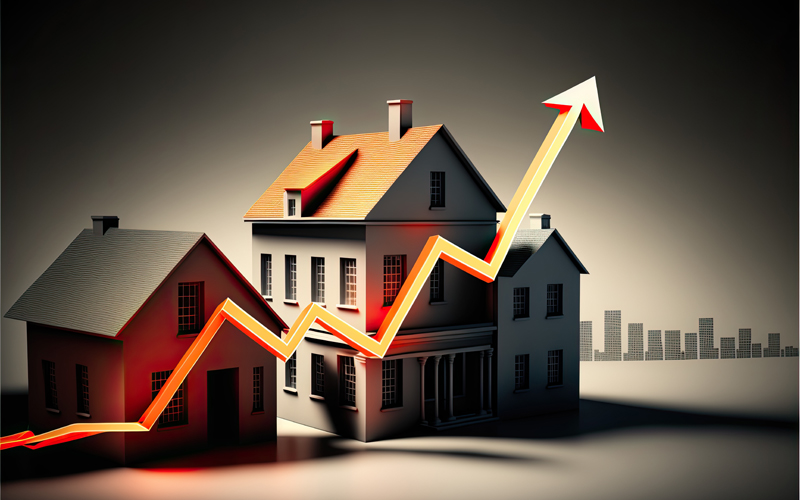
The two-speed property market still looking strong.
Property potential - house vs home unit.
What the charts tell us about gold and silver.
But a bit of fun first up. You know what a finance nerd I am, so I was overjoyed to see that the Australian Bureau of Statistics has released a range of merchandise. Yep, just as I have put away my Taylor Swift merch after accompanying my daughters and granddaughters to the recent tour, I can now buy an ABS bucket hat and hoodie.
Love it.


Why the property squeeze will not be easing anytime soon
I have a pretty comprehensive property update coming up shortly but the shortage of new houses is not going to be rectified anytime soon.
The number of Aussie building approvals fell 1.9 per cent in February… and down 5.8 per cent on a year ago. Apartments drove the bulk of the decline in the month. Volatile private sector dwellings excluding houses approved fell by 24.9 per cent but private sector houses rose 10.7 per cent.
Council consents for higher density dwellings, such as apartments, fell to the lowest level in 12 years in February.
In the year to February 2024, there were only 163,099 approvals to build new homes. Around the lowest annual total in almost 11 years, and well below the Federal Government’s 240,000 annual target established under the National Housing Accord.
The slower building activity will be ahead of a fall-off in demand for architects, builders and building material suppliers.

Inflation comes in at a better than expected 3.4 per cent a year
Speaking of the ABS, its latest CPI figure for February came in unchanged from the previous month at 3.4 per cent for the year, which was still slightly under the 3.8 per cent predicted by a lot of economists.
The Reserve Bank will be pretty happy with that figure which shows it is hovering just above its desired 2-3 per cent target band. After the recent strong downtrend in inflation, the RBA has been concerned that inflation could take longer than expected to go that “last mile” to under 3 per cent.
Rising housing costs were again the main contributor to inflation. The pace of rental price growth picked up, rising by 0.8 per cent in February to be 7.6 per cent higher (double inflation), over the year. Take out rental assistance and the actual rent increase is a whopping 9.3 per cent.
It’s worth pointing out here that more than 700,000 overseas students are living in Australia, the highest figure on record. Figures out this week show there were 713,000 people on student visas in Australia in February, 50,000 more than the previous record of 664,100 last September.
And all of them need somewhere to stay.
It’s not just rents driving inflation but also the cost of new homes which rose 0.3 per cent for February and 4.9 per cent for the year. The silver lining is the annual 5 per cent rise in costs looks to be stabilising despite the ongoing rise in materials and labour costs.
Together with rents, these two housing categories contributed just under half of the monthly increase in consumer prices. The weights for these two categories are around 14 per cent of the total CPI basket.
Electricity prices actually fell by 0.6 per cent over February. The government’s Energy Bill Relief Fund continues to push down out‑of‑pocket costs for electricity. These rebates mean that electricity bills are around 15 per cent lower than otherwise. The unwinding of these rebates are occurring later than anticipated.
While the price of goods has been consistently slowing, price growth of services has been strong and that has been the worry for the RBA. But there are some good signs here as well.
Inflation for restaurant meals and takeaway both eased to 0.5 per cent with the annual rate falling from 5.6 to 5.3 per cent. Other household services inflation declined further to just 2.3 per cent for the year… a long way down from its peak of 9.9 per cent.

Aussies tightening their spending belt… except for the Swifties
As I admitted earlier, I did spend up for the Taylor Swift tour but it seems I wasn’t alone. The music superstar even received a special mention by the Australian Bureau of Statistics when reporting on the latest retail sales figures.
“Seven sold‑out Taylor Swift concerts in Sydney and Melbourne boosted retail spending this month, with over 600,000 Swifties flocking to these events. This led to increased spending on clothing, merchandise, accessories and dining out.”
The official figures showed a 0.3 per cent rise in retail spending in February but take the so-called “Taylor Swift effect” out of the figures and spending only edged up 0.1 per cent. Yes, the economic impact of Taylor Swift was huge.
If you also take into account the high levels of migration, then it’s clear Aussies are not spending much at the shops.
And if allowance is made for the high levels of migration, clearly retail spending is going nowhere at present.
In February the largest gains in spending were in the categories of clothing & footwear (+4.2 per cent) and department stores (+2.3 per cent) because of Swifties. Cafes, restaurants & takeaway also saw an impact, rising by 0.5 per cent but household goods were down (‑0.8 per cent), as was retailing (‑0.4 per cent) and food retailing (‑0.1 per cent).
Given the reasonable CPI figure and subdued retail spending… the RBA is pretty relaxed
I wrote a couple of weeks about Reserve Bank Governor, Michele Bullock being our financial therapist. Playing with our minds to deliver the right economic outcome.
I think she’d be pretty happy with her patients given the soft retail spending and better than expected CPI result. That certainly showed in the minutes from the last board meeting which were released this week.
The language was more cautionary than some of the more aggressive comments of the past.
The Minutes state that, “members agreed that returning inflation to target remained the Board’s highest priority and that it would take some time before they could have sufficient confidence that this would occur within a reasonable timeframe. At the same time, members noted the importance of preserving as many of the gains in the labour market as possible.
“… it was appropriate to characterise the policy outlook as one in which it was difficult to either rule in or out future changes in the cash rate target.”
This is a crystal-clear neutral bias.
The Minutes noted that the economy is “tracking broadly as (the RBA) expected”, and the Board behind closed doors will view the likely next move in the cash rate as down. But it is too early for the Board to shift to an easing bias.
“Overall financial conditions in Australia were considered to have remained restrictive”. The strength of the housing market is no longer feeding into the Board’s assessment of how restrictive monetary policy might be.
Cash may be tight but wealth is still rising
The old saying about being “cash poor and asset rich” has never been more relevant. High inflation and the sharpest rise in interest rates for a generation has really squeezed household budgets.
But while it’s tough to make ends meet on a day-to-day basis, the overall wealth of Australians continues to rise.
Australian household wealth has hit an all-time high, rising for the fifth straight quarter, with property, cash and share assets all hitting record-high levels in December 2023, thanks to direct ownership of shares as markets surge and the impact of rising property values.
Last week’s ABS Household Wealth Data shows household:
Net wealth sat at a record $15.66 trillion in the December 2023 quarter.
Wealth was boosted by a record level of property assets of $10.66 trillion.
Direct shareholdings hit a record $1.40 trillion.
Held a record $1.70 trillion in cash and deposits.
Held a record $3.74 trillion in superannuation.
All of these assets are at record-high levels.
The ABS data showed that ownership of shares surged over the December quarter, with households’ direct ownership of equities rising 3.8 per cent or by $51.8 billion to $1.40 trillion. House prices continued to grow significantly, as did domestic and overseas share markets, despite higher rates.

A couple of surprising charts that have caught my attention
As you know I love a good chart. I reckon a picture (or chart) can tell a thousand words.
A couple of weeks ago I was warning you chocoholics to buy up big before the skyrocketing price of cocoa was passed on to consumers. Have a look at this. A tonne of cocoa is now worth more than a tonne of copper for the first time ever.
That is incredible.

And I’ve covered the incredible surge in the share price of the Magnificent Seven big technology stocks in the US. They have been almost single-handedly driving the US market.
The leader of the pack has been the manufacturer of Artificial Intelligence silicon chips, Nvidia. This stock has captured the imagination of the investment world.
But when any investment booms, I become very cautious. History tells us booms always end and usually the bigger the boom the bigger the bust that follows.
Have a look at this chart from the Game of Trades X account, which plots Nvidia’s current share price chart against that of tech giant Cisco, when it went through a similar boom in the late 1990s.

Australia’s listed gold mining companies have seen their share prices surge over the last couple of months on the back of a surging gold price which broke up through US$2,200 an ounce this week. That’s the equivalent of about $3,300 Australian dollars.
When you consider major Australian gold producers can dig the stuff out of the ground for about $1,500-1,800 an ounce, that is a pretty good profit margin. It’s literally a “river of gold”.
The fact that the gold price has broken through that resistance level on the chart has analysts very excited.

But while gold is getting all the attention, the commodity analysts are reminding us to not forget about silver. Its chart is looking very interesting and forming a “head and shoulders” pattern which could signify an upwards price breakout.

Property values up again in March
CoreLogic's national Home Value Index (HVI) rose 0.6 per cent in March - the same increase as the month before and the 14th straight month of growth.
Since declining 7.5 per cent between April 2022 and January 2023, the national HVI has increased 10.2 per cent, or, in dollar terms, by approximately $71,832, rising to new record highs each month since November last year.
Every capital city except Darwin (-0.2 per cent) recorded a rise in dwelling values over the month.
Perth’s housing market was the fastest growing where values were up 1.9 per cent over the month, followed by Adelaide and Brisbane with 1.4 per cent and 1.1 per cent growth respectively.
The remaining capitals are showing much lower rates of change, although Melbourne is the only capital city to record a negative quarterly movement, down 0.2 per cent over the first three months of the year.
Although housing values are rising faster than at the end of last year, the quarterly trend of growth has halved relative to the middle of last year when home values were rising 3.3 per cent quarter-on-quarter.
As I’ve often pointed out, low building levels and high migration is creating a property squeeze. For example, last month’s ABS population data showed net overseas migration to WA was running well above average at 18,122 in the September quarter of last year (up from a decade average of 4,639 per quarter), a trend seen in most states.
Interesting to see Brisbane’s median value streaking ahead of Melbourne… and Adelaide will overtake Melbourne at this rate pretty soon.

Source: CoreLogic
Those value rises are also translating into widespread gains. A recent suburb-level analysis using CoreLogic’s interactive Mapping the Market tool found that 88.4 per cent (4,087) of the 4,625 house and unit markets analysed nationally saw values rise over the year. This is up from just 52.9 per cent of markets in July 2023, and up from the 39.1 per cent per cent that recorded positive annual growth in February 2023.
Despite three rate hikes, worsening affordability, and the rising cost of living, the increasingly entrenched undersupply in housing stock, and above average demand thanks to strong net migration, has helped push values higher.

Source: CoreLogic
Brisbane, Adelaide, and Perth saw the most widespread value uplift year-on-year across both houses and units. All 312 house and 167 unit markets analysed in Brisbane have seen values rise over the year. The inner-city suburb of East Perth (-0.8 per cent) was the only market in the western capital to record a decline in house values, while only one house (Black Forest) and one unit market (Glenelg South) in Adelaide saw values fall over the year to February.
Not only have the annual increases in these cities been fairly broadly based, they’ve also been very strong, with the majority of suburbs recording double digit value growth.
In Perth, 93.7 per cent (374 out of 399) of markets recorded a capital gain of 10 per cent or more over the year. Brisbane saw 86.4 per cent of house and unit suburbs rise by more than 10 per cent with the fastest rising markets clustered around the Brisbane-South and Logan-Beaudesert regions, while three quarters of Adelaide markets recorded double digit annual growth.
The same analysis found that 94.2 per cent of the 4,030 house and unit markets analysed recorded an annual rent rise, while nearly 40 per cent saw rental values rise by 10 per cent or more.
Over the past few years, rental growth has been skewed to capital city units, but as unit rent affordability has been eroded, some prospective tenants may be shifting towards house rentals, likely reforming larger households as a way of sharing the rental burden or to more affordable markets further afield.
Perth was by far the best-performing capital for annual rental growth, with all 245 house and 101 unit markets analysed recording increases over the year, while 85.8 per cent saw an annual rent rise of 10 per cent or more. Hobart sat at the opposite end of the scale, with just seven of the 39 house markets analysed seeing a rise in rents, while all 13 of the unit markets analysed saw a decline, ranging from -1.4 per cent (Sorell) to -5.6 per cent (Lenah Valley).

Source: CoreLogic

Property values: Houses vs home units
Standard investment advice is to always buy a house instead of an apartment if you can afford to do so. The primary reason being that house price growth always exceeds unit price growth over the long term.
According to Ray White Chief Economist, Nerida Conisbee, while this is often the case, it doesn’t always hold true. For example, an apartment in one suburb may outperform a house in another. Less common, however, is unit price growth within a suburb outperforming houses in the same suburb.
Over the past 12 months, unit price growth in Brisbane and Adelaide has exceeded house price growth. Part of the reason for this is a combination of underbuilding and population growth. Whereas Sydney and Melbourne went into the pandemic with a strong pipeline of new development, this wasn’t the case elsewhere. Brisbane specifically has seen very strong population growth since then. Adelaide has also seen similar growth.

The result in regional South Australia is also interesting, according to Nerida. Units include anything that isn’t a freestanding house. Both townhouses and apartments have done well in regional South Australia off the back of strong economic conditions.
Over the past two years, South Australia has been the strongest growth state… agriculture has been a strong performer but also the state’s mining sector has done well, in particular copper mining.
In total, there were 294 suburbs where unit price growth exceeded house price growth. Sydney, Brisbane and Melbourne dominate, partly because they are the biggest cities.
However, it is also likely that a larger number of high quality apartments being developed is lifting the median.

The suburbs with the biggest gaps in house and unit price growth are relatively diverse geographically and relatively expensive. The impact of the development of better quality apartments becomes more apparent at this level.
Ivanhoe, for example, in Melbourne’s north-east is an expensive suburb that has seen a lot of new apartments built over recent years. The apartments being built are bigger and higher quality than the older style apartments that existed.